2. Getting Started
This guide assumes that you have already installed pypfilt:
# Install pypfilt with plotting support.
pip install pypfilt[plot]
See the installation instructions for further details.
The rest of this guide will demonstrate how to generate forecasts and produce plots like those shown below.
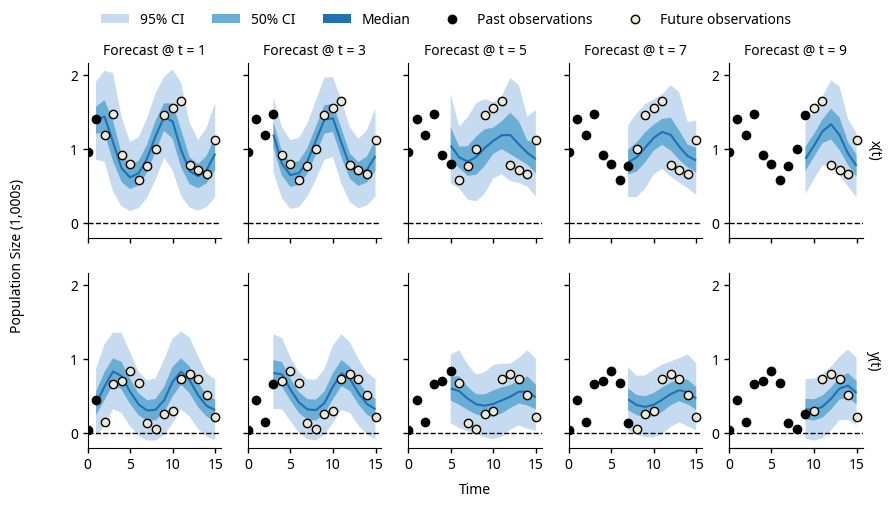
Forecasts produced by the LotkaVolterra model, using noisy
observations generated by this same model (LotkaVolterra.obs())
and a known ground truth.
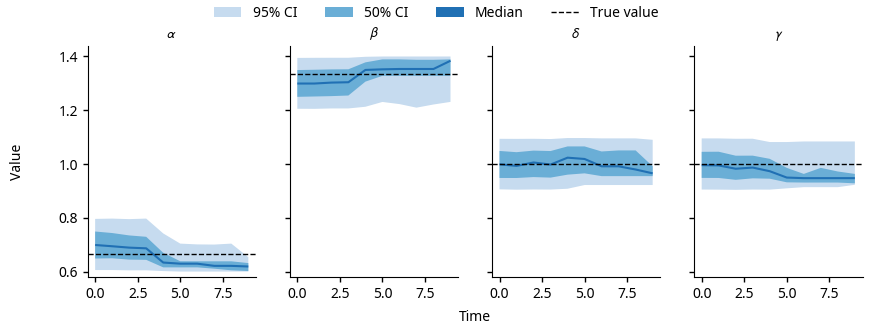
The posterior parameter distributions for the LotkaVolterra
model, using the noisy observations shown in the forecasts above.