2.7. Plotting the results
Plotting the forecast results is a two-step process; first, the results must
be read from the output file and arranged into an appropriate form, then the
plots must be constructed.
The pypfilt.plot module provides functions for plotting observations
and credible intervals, and classes for constructing figures with sub-plots.
The pypfilt.examples.predation module provides a convenience function
for plotting forecast credible intervals and model parameter credible
intervals for this example, as shown below.
You can generate these figures from the outputs recorded in 'output.hdf5'
by running the following code:
import pypfilt.examples.predation

data_file = 'output.hdf5'
pypfilt.examples.predation.plot(data_file, png=True, pdf=False)
This will save the plots to predation_forecasts.png and
predation_params.png.
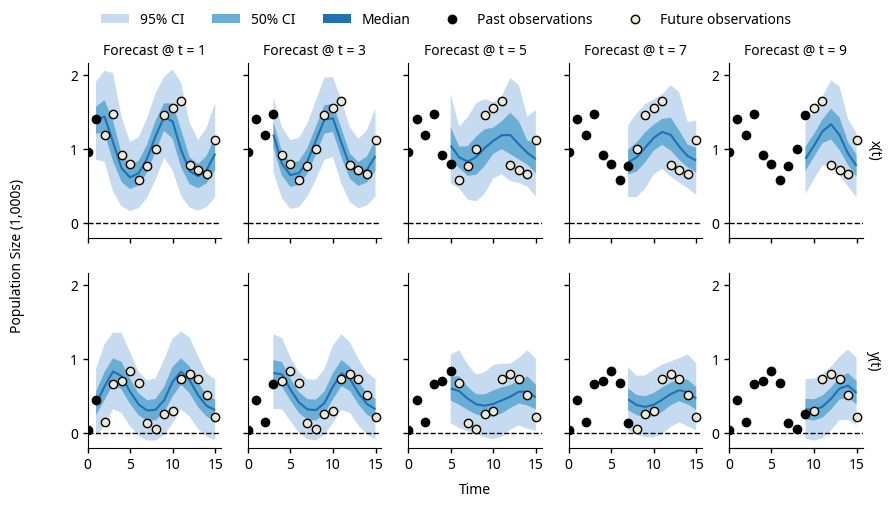
Forecasts produced by the LotkaVolterra model, using noisy
observations generated by this same model (LotkaVolterra.obs())
and a known ground truth.
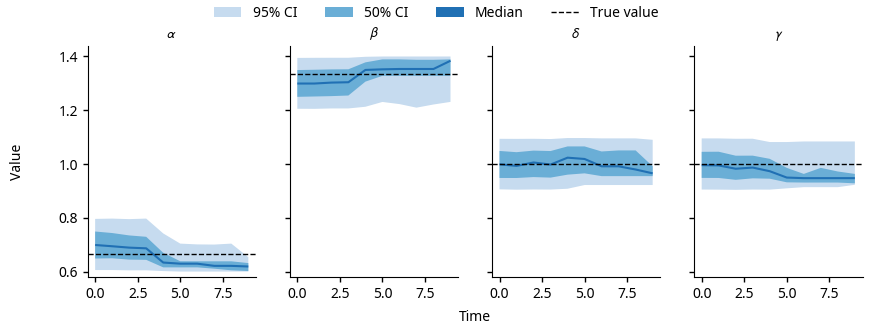
The posterior parameter distributions for the LotkaVolterra
model, using the noisy observations shown in the forecasts above.