Getting Started#
This guide assumes that you have already installed pypfilt:
# Install pypfilt with plotting support.
pip install pypfilt[plot]
See the installation instructions for further details.
This guide shows how to build a simulation model, generate simulated observations from this model, fit the model to these observations, and generate the forecasts shown below.
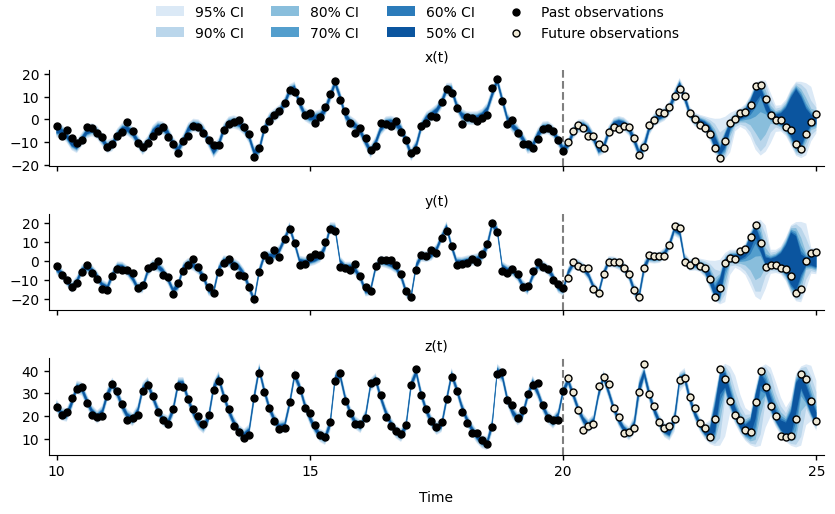
Forecasts for \(x(t)\), \(y(t)\), and \(z(t)\) of the Lorenz63 system at time \(t=20\).#